I don’t think many people will dispute the fact that males are responsible for the vast majority of sexual offences, and females make up the vast majority of victims.
Of course, of course, #NotAllMen and so on but this is, ultimately, one of the key reasons we have separate spaces – it is a pragmatic way we have established for protecting the safety of women and girls. Imperfect, but effective.
I’m always open to new sources of information but, as far as I have been able to discover, there are very limited statistics to help inform the discussion on the inclusion (or not) of trans-identified males in women’s spaces.
And when it comes to any legislation, we cannot responsibly base this on anecdotal evidence or knee-jerk emotional responses. Ultimately, we need data to really understand this and formulate the best approach we can.
Given this, I don’t think you can sensibly dispute that it would be helpful to have an accurate picture of whether trans-identified males represent – for example – a similar level of threat to men, or whether they are demonstrably safer in some way. And, of course, we should keep in mind that, even if the offending rate is the same as males in general, this does not mean every trans-identified male is unsafe, or no more so than the average.
There is one study I am aware of, carried out in Sweden, which looked at 324 sex-reassigned persons (191 male-to-females, 133 female-to-males) between 1973 and 2003. What they found is that “male-to-females had a significantly increased risk for crime compared to female controls” and that “they retained a male pattern regarding criminality”. Even though this was some time ago, the treatments were very similar to those who undergo medicalisation today: cross-sex hormones, vaginoplasty.
That said, a significant proportion of more recently trans-identified men do not undergo this type of treatment and many simply self-identify. Data that takes into account that current landscape would be informative, and you may have seen the following graphic, which I came across online. This at least appears to offer something more recent. (I’ve marked it “unverified” for reasons you will see below.)
It relates to the rate at which different groups commit sexual offences, comparing the number of convicted offenders to the overall number in the population, and appears to show that men who identify as women offend at a much higher rate. According to the numbers in this graphic:
Nearly 5 times higher than men (4.8x)
More than 600 times higher than biological women (639x)
If this data is representative and accurate, then it is fairly hard to dispute it would be cause for concern or, at the very least, grounds to ask questions about why, and what the implications are.
It appears to include links to credible sources but do they back up what it claims? Is it representative? What are the caveats we need to know about? I set about finding out.
What is the linked evidence?
The graphic provides a link to (an archive of) UK prison service statistics, which contains data relating to the prison population, published by the Ministry Of Justice (MOJ):
There are a number of documents available on this page, including a spreadsheet containing prison population data, categorised and broken down in a number of ways. The key tables I’ll be referring to here are:
Table 1.1: Prison population by type of custody, age group and sex
Table 1.2b: Prison population under an immediate custodial sentence by offence group, age group and sex
The graphic also references a link to the information on gender identity data gathered as part of the 2021 census:
This page contains a link to a spreadsheet that shows the responses to the census question on gender identity. The key information is in Figure 1: Gender identity, 2021, England and Wales (shown below).
Analysis of Linked Data
At a first glance, the figures look broadly like they match the graphic - e.g. the census data shows there were indeed around 48,000 people declaring themselves to be a “trans woman” in March 2021:
The prison population data looks roughly right too – a quick scroll of the data in table 1.2b reveals that the data linked includes a figure for male sex offenders that exactly matches the data in the graphic - 11,660:
So far, it looks superficially like these documents support the numbers listed in the graphic. However, if we look a little closer, there are some things that don’t quite line up.
To begin with, the number that appeared to match is for June 2021, whereas the census took place in March 2021. So really, we ought to be using the March 2021 figures from the table for comparison (as above = 11,558).
In addition, the links provided in the graphic do not cover all of the data used in the illustrated calculations. The following are some gaps I’ve identified.
Overall Population Numbers
The graphic does not give a source that includes the total numbers it uses for males and females in the country, cited as 29.5 and 30.4 million, respectively.
However, with some minimal investigation, we can follow links on the census website and find the overall numbers recorded:
Although not exactly the same, this matches the numbers in the graphic pretty closely.
Numbers of Transgender Sex Offenders
More questionable, however, is the fact that the linked prison population data only shows numbers of offenders broken down by sex and not by gender identity, so it contains no information on the number of transgender prisoners who have been convicted of a sexual offence.
This is really the most critical piece of information here, and the graphic hinges on it. Not having it clearly linked is a significant oversight.
But let’s apply the principle of charity, and assume this data does exist somewhere, but the author has just failed to provide a link. I began looking for sources of data that might have been used to arrive at these numbers.
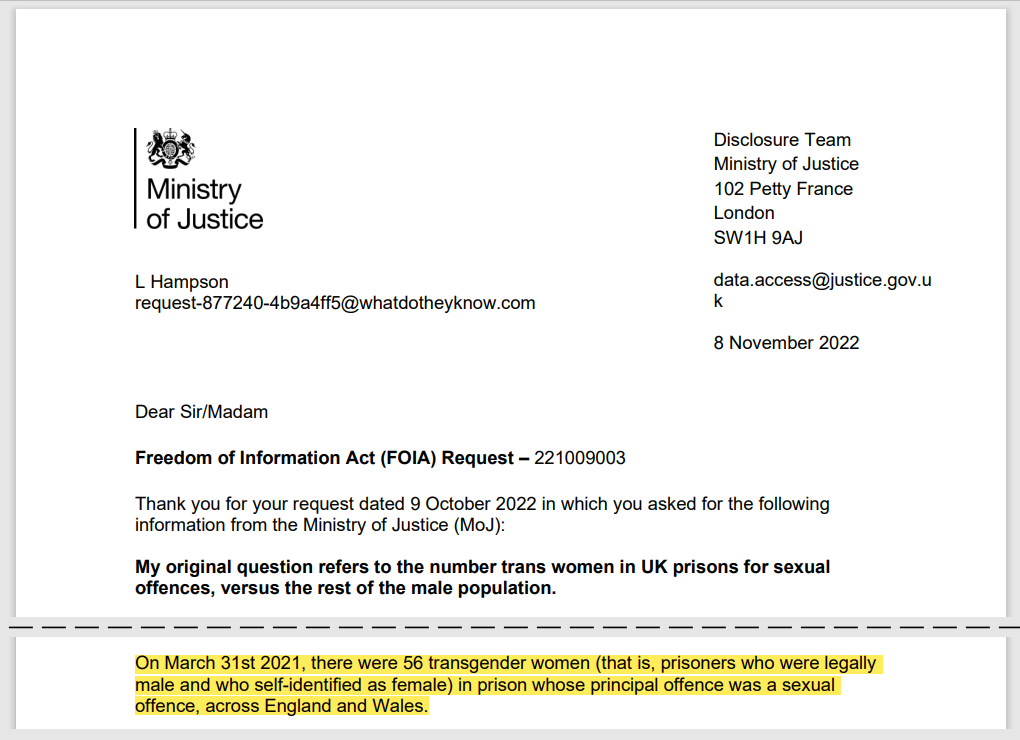
As ever, I am absolutely open to information I may have missed, but the only source I have been able to find is the following Freedom Of Information request to the prison authority for England & Wales:
The date given for this figure (31st March 2021) matches exactly one of the sets of data in the prison population data, and is also very close to the census date (March 21st 2021), which makes comparing these values a reasonable thing to do.
However, this stated number of 56 is very different to the 92 quoted in the original graphic.
It is possible that there are another 36 prisoners whose “principal offence” was something else but who are also in prison for a sexual offence, or that this number does not include trans-identified males with a gender identity other than “female”. If that is the case, I have not been able to find a record of these numbers.
Nevertheless, we can be confident that there were at least 56 trans-identified males whose principal offence was a sexual offence.
This point also raises an interesting question about the overall MOJ prison population statistics: are they categorised based on a single, principal offence? Or could prisoners be double-counted if they have multiple offences?
Although this is not explicitly documented in the notes for the prison statistics, we can tell whether prisoners have been double-counted by comparing the totals across all offence groups to the total prison population. If we do this comparison, looking at table 1.2b, we can verify that the total number is the sum of all the individual groups:
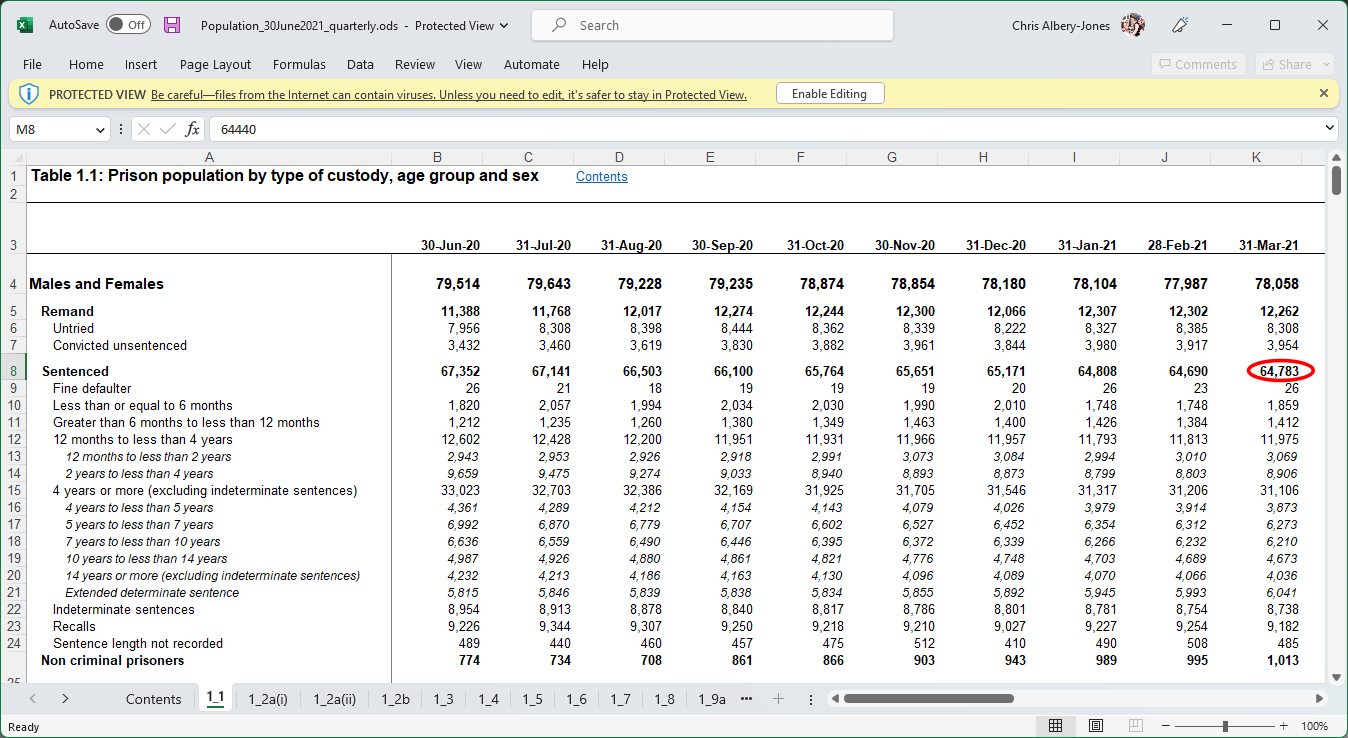
For completeness, I compared this figure to the total number of sentenced prisoners given in table 1.1, as I supposed those two should match. However, I discovered that the total number of prisoners was slightly higher: 64,783 rather than the 64,757 that were categorised into offence groups; a discrepancy of 26 prisoners. It couldn’t be that the offence was simply not recorded / unknown, as there is a specific group for such cases.
I puzzled over this, but then spotted that the missing 26 people corresponded to the “Fine defaulter” row in table 1.1. Applying a similar process to each of the other monthly figures, we can see that this consistently matches and, therefore, it appears the fine defaulters are excluded from those listed in table 1.2b, for reasons that are not mentioned in the guidelines.
However, putting all of this together, it was enough to convince me that prisoners have not been double-counted and therefore each prisoner has only been listed against one offence category – i.e. these numbers must also indicate the main, or principal, offence that the prisoner committed. That is the assumption I am therefore working on.
This means it should be valid to compare the figure in the FOI request with the data given in the prison population data.
Numbers of sex offenders
Looking at the prison statistics referenced above, the contents page of the spreadsheet states that it contains data for England and Wales, which matches the census data we are using.
Looking at Table 1.2b, we can see a breakdown of offences by type, separated by sex:
As we can see, for the date of March 31st, 2021 (closest to census date) the following figures are shown:
Males, sexual offences: 11,558
Females, sexual offences: 109
Numbers of trans-identified males in the population
As noted above there are around 48,000 “trans women” recorded in the census. However, the original graphic overlooks the fact that there are a further 166,106 people who identified as trans on the census, making the total 262,113 trans individuals.
Of that total number, the only group we can confidently say must be female are the “trans man” group - if not, they could not be listed as trans. For similar reasons, we know that those in the “trans woman” group must be male.
However this leaves 146,106 transgender individuals which we cannot confidently classify as male or female. And therefore the true number of males who identify as transgender is somewhere between 47,572 and 193,858 (146,106 + 47,572).
However, given there is approximately a 50/50 split of males and females in the general population, and that the numbers identifying as “trans man” and “trans woman” are also approximately equal, I’m going to work on an estimate that half of the remaining 146,106 are biologically male, which is another 73,053.
That gives us an estimate of a total of 120,805 trans-identified males in the population of England and Wales.
Overall population figures
We also need to revisit these numbers to make our comparison as valid as possible - the numbers of transgender individuals recorded in the census are based on the answers to the question on gender identity, which was only completed by those aged 16 or older.
Therefore, we need to make sure any comparison uses the total numbers of overall males and females in the same age range. This data is available broken down by age on the census website.
If we add up the entries for those 16+ in this data we get the following totals:
Sum of all female entries age 16+: 25,039,098
Sum of all male entries age 16+: 23,527,203
Recalculation
Based on all of the above, that gives us the following overall totals for those aged 16 and over:
Total males: 23,527,203
Trans-identified males: 120,805
Non-trans males: 23,527,203 - 120,805 = 23,406,398
Total females: 25,039,098
Trans-identified females: 121,488
Non-trans females: 25,039,098 - 121,488 = 24,917,610
If we now re-do the sums shown in the original graphic, here’s what we end up with:
As we can see, the rate of offending seems to be similar in both trans and non-trans males - in both cases around 120 times higher than in females.
Note that we don’t have numbers for trans-identified females in prison principally for a sexual offence, so we can only calculate the overall number for all females, collectively.
These results do not support the high number shown in the original graphic, but they do support previous studies that have shown trans-identified males retain male patterns of offending, and that they therefore offend at a much higher rate than females.
So, here’s an updated graphic showing the validated figures:
Hopefully people will be able to feel confident sharing this graphic, as the numbers are fully transparent, and the assumptions documented here.
It’s possible there are other sources of data available that back up the original graphic, and that I have simply been unable to locate them. But I haven’t been able to validate the original, hence marking it as “unverified”.
I’ve also made estimates and assumptions here that mean the actual numbers could vary significantly, given additional information.
For example, if it turned out that the 56 offenders identified in the above FOI request was limited to those who identify as a “trans woman” and excluded non-binary prisoners, this could imply that using the census value for “trans women” could be valid. Using those numbers we end up with a rate of offending that is much higher, and much closer to the original: 1,177 per million.
However, as I can’t currently confirm that with the data available, I haven’t quoted that figure in the graphic - instead, I’ve taken a conservative route here to give as robust and defensible an answer as possible. I think it is legitimate to say we can assume the offending rate is at least what I have documented here for trans-identified males.
There are currently other outstanding Freedom Of Information requests, such as this one, which may shed additional light on these statistics - if and when more information becomes available, I will post an update.
As ever, please do let me know if you spot any errors, invalid logic or inconsistencies in any of this.
SPoaTK
Updates / Version History
17th May 2023
Updated section on the Swedish study summary to remove unintended implication that it is was less valid due to being older, and to clarify the similarities with current treatment pathways. Highlighted the differences compared to some of the current trans-identified males.
6th June 2023
Today there was a response on one of the FOI requests relevant to this piece, which is available here.
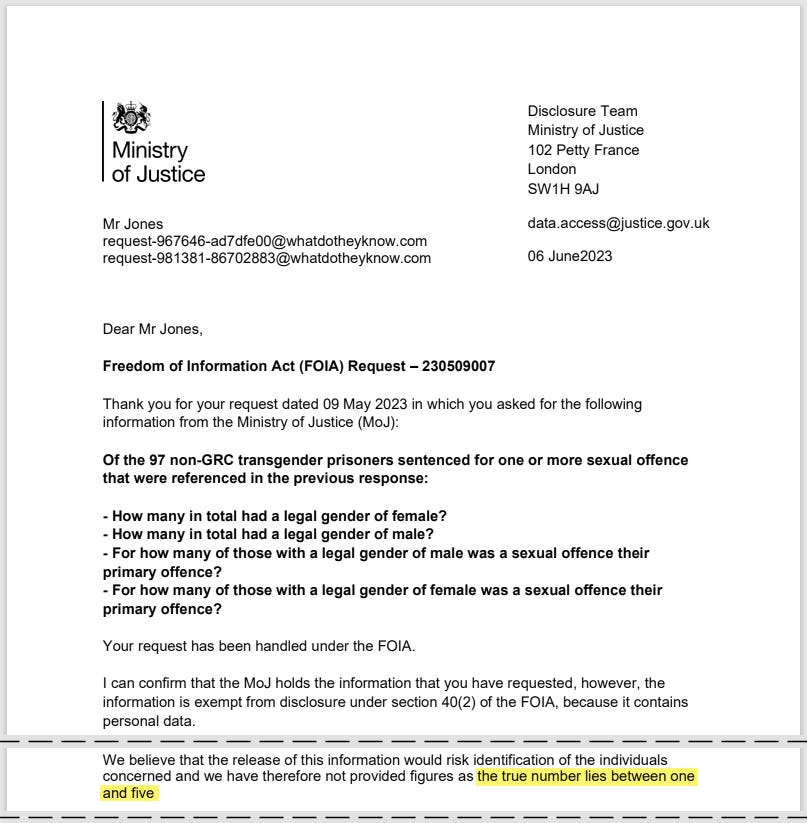
As a quick recap, this requested clarification on a previous FOI request which revealed that, of the 197 transgender prisoners held in England and Wales in March 2021, 97 had been “sentenced for one or more sexual offence”:
At a first glance the new response may seem unhelpful, because it states that the requested information cannot be disclosed. However, the reason for not releasing the information is that one of the figures “lies between one and five”:
The only legal genders recorded by the prison service are male and female, which therefore means the other figure cannot be released either because it allows the smaller number to be deduced - e.g. if they had released data saying that 95 of the 97 prisoners with a conviction for a sexual offence were legally male, we could deduce that only 2 were legally female.
Given what we know about the general pattern of sexual offences in males and females, it is highly unlikely that the larger number is the female part of the total and, assuming that is the case, we can deduce a number of things:
At least one of the 97 convicted sex offenders is legally female.
No more than 5 of the offenders are legally female.
At least 92 of the convicted sex offenders are legally male.
This last number seems to correspond to the figure of 92 quoted in the original graphic, and I therefore suspect this is the root of this figure. That means it was (in my opinion) not valid to compare this to the total number of offenders whose principal offence was a sex offence, and the figure of 56 I sourced appears to be more valid for this purpose.
However, we also know from the HMPPS Offender Equalities Annual Report 2020/21 that there were a total of 158 transgender prisoners with a legal gender of male:
We can therefore calculate that at least 58% of trans-identified males in prison were sentenced for one or more sexual offence. Here’s a graphic with the new info:
Click here for a high resolution version of the image
It would be interesting to compare this proportion to the overall male prison population but, as yet, I have not been able to find this data, as the published information focuses on the principal offence. Further FOI requests may be needed to uncover this information - watch this space…
15th June 2023
There was a further update on another FOI that is relevant to these statistics a couple of days ago, and this allows for some further adjustments.
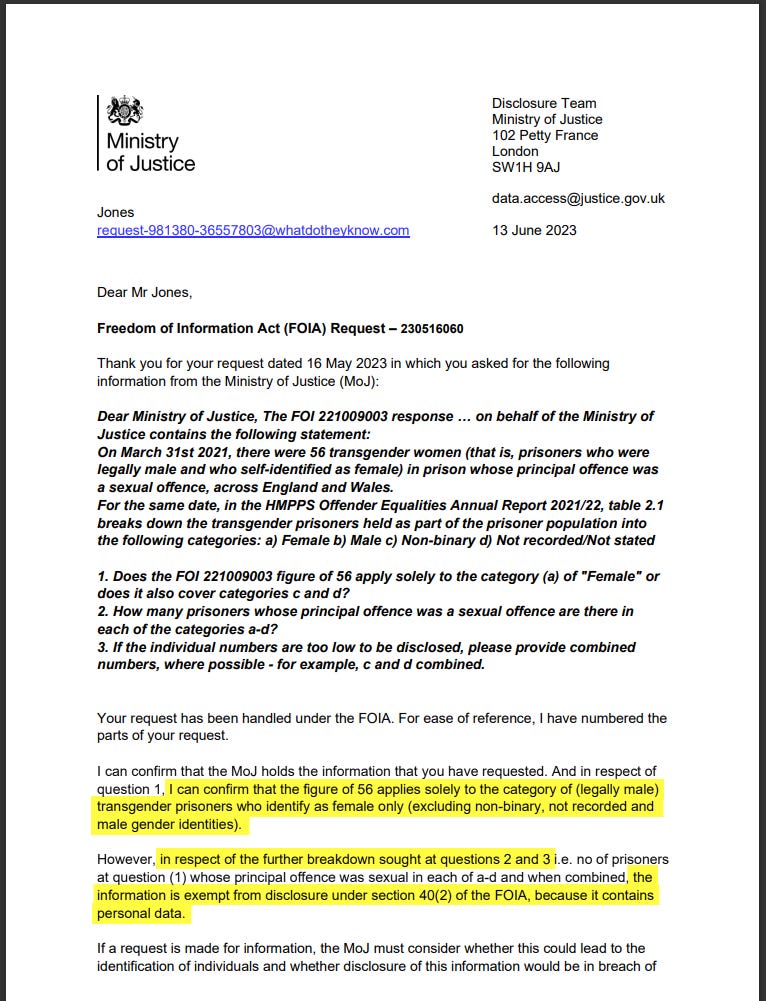
The FOI confirms that the figure of 56 used in the graphic covers only “the category of (legally male) transgender prisoners who identify as female only (excluding non-binary, not recorded and male gender identities).”
This provides a missing piece from the original analysis, and means that it therefore appears to be valid to use this offending rate in conjunction with the overall number of the population who are males identifying specifically as women - that is to say, the 47,572 individuals recorded in the census.
This sheds a different light on the offending rate as a rate of 56 out of 47,572 corresponds to a much higher rate of 1,177 per million than originally shown, as was noted previously as being possible. Here’s a table with the updated figures:
And here is a (further) updated graphic:
Click here for high resolution version of this image
It’s important to add that, as we can see, the precise definitions used and the reliability of the numbers in the census have a large effect on the overall calculated rates - here we see a change in our understanding has more than doubled the rate shown in the graphic.
That said, I think it is clear that there is little evidence that males who identify as women offend at a lower rate than other males, and reasonable evidence they offend at a significantly higher rate.
As an aside, we can also conclude from this new FOI response that the total number of offenders across the remaining categories is 5 or less. This would include any other transgender prisoners, male or female, including:
Females identifying as men
Males or females identifying as non-binary or another transgender identity
Males or females identifying as transgender but with no specific identity
In theory we could use this to make some estimates about the offending rates in this group, but we would be guessing at the actual total and the numbers are so low that I think it is unlikely to be meaningful.
As ever, I will be updating further when new information becomes available - please let me know if there is anything you think should be included.
Update 16th June 2023
I decided to take a look at the numbers around offending for other trans identities, even though - as mentioned in yesterday’s update - there is limited information and we have to make estimates and use a range rather than a specific value. I think the results are worth sharing even though there is a large uncertainty around them.
Here’s my logic: although the response says that the individual values for the other groups requested in the FOI could be zero, I think we can sensibly conclude that the overall number across categories must be at least 1 because, as far as I can see, if it was zero for all categories, there would be no danger of breaching any prisoner’s privacy and the number could then be released.
This puts the number of offenders across all other trans identities (i.e. excluding those who are males identifying as women) somewhere between 1 and 5.
Looking at the census, this group in the overall population would be the sum of all of the values in Census figure 1 (262,113), excluding the 47,572 males identifying as female - that gives us a total of 214,541 individuals.
Assuming the minimum number of offenders (1) this would give an offending rate of about 5 per million. If we took the larger figure of 5, that would give us approximately 23 per million. This is obviously very crude, but gives us an idea of the ballpark figure.
Another caveat to be aware of is that a question mark has been raised over the possibility of numbers reported in the census as being inaccurate due to confusion. Michael Biggs carried out a detailed analysis of this, available here.
The reason this is important is because, if the number of trans people was significantly over or under reported, it will affect the calculated rates shown here.
For example, nearly 118,000 people checked the box indicating they were transgender but did not then specify any particular identity, even though they could write in whatever they wished. Let’s imagine those were all people who were simply confused about the question and were not actually transgender. That would change the overall population figure for our new calculation from 214,541 to 96,766. That in turn increases the offending rate from 23 to 51 per million, in the case where there are 5 offenders in prison.
That being said, even this fairly extreme assumption does not put the overall offending rate anywhere near the level shown for males who identify as women, hence my feeling that this is still an interesting ballpark figure. It would suggest that males who identify as women do present a significantly greater threat than other trans identities.
As ever, we need more information, and our understanding will no doubt change as more data becomes available. My guess would be that the figure for other gender identities will end up being close to the rates you’d expect based on sex - i.e. if it is mostly females, it will approach the female rate, if it is mostly males, it will approach the male rate. Time will tell.
In any case, here is a graphic showing this new comparison, with a clear caveat on the data shown:
Click here for a high resolution version of the graphic
In addition, I expressed the data from yesterday’s update in a different form, to help visualise the stats and to emphasise the importance in relation to the safety of women’s spaces:
Click here for a high resolution version of the graphic
The numbers here are calculated as follows:
56 taken directly from prison stats, as all 47,572 males identifying as women will fit in the stadium
Other men = (11,502 / 23,479,631) x 47,572 = 23.3
Females = (109 / 25,039,098) x 47,572 = 0.2
(I chose the Stadium Of Light because it is closest to the capacity needed to hold 47,572 people - its capacity is 48,707)
On a separate note, I’ve also updated the graphic I produced yesterday to highlight the caveats around the data, as I think it is important to present this in a clear way.
Update 26th July 2023
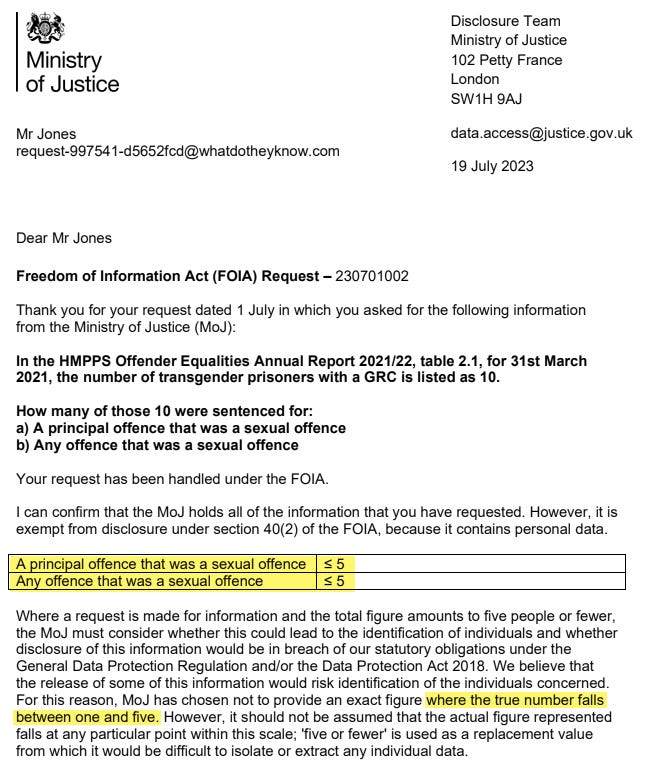
An additional response was received on FOI 230701002 which does not tell us a huge amount but does allow some minor conclusions. The response included the following:
We can’t determine a lot here, but we can conclude that there is at least 1 person with a GRC who was sentenced for a principal offence that was a sexual offence. Therefore, any claims that such offences are not committed by those with a GRC can be disproved.









Don’t worry! They’ll keep assigning violent & sexual crimes committed by transwomen to women until the rates even out.
Nice thorough job, thank you!
I have one quibble - the Swedish long-term followup study is no less valid for being completed 20 years ago. Long-term followup studies by necessity start a long time ago, studies on human behavior generally don't have a shelf life, and none of the key factors that influenced the results have changed in 20 years as far as I can tell - the hormones and surgery methods are the same, crime and mental health stats collection methods are the same, etc.
TRAs criticize the study and its interpretations in any way they can, of course, including claiming that it is outdated, but they just throw as much crap against the wall as they can hoping it will stick.